What are vegetation indices and why are they important?
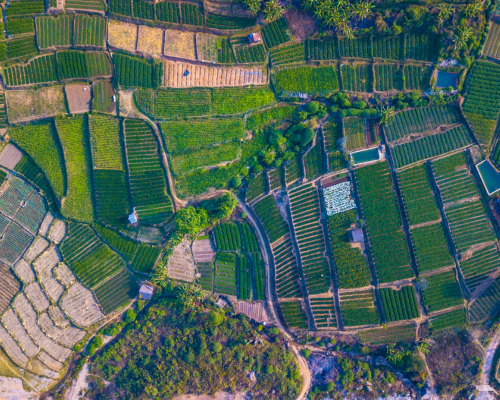
In an increasingly challenging global context, the ability to access accurate, real-time information is transforming agricultural management. Satellite imagery has become an essential tool for precision agriculture , enabling smart, sustainable, and profitable decision-making.
From these satellite images, vegetation indices are calculated using mathematical formulas based on different bands of the electromagnetic spectrum. These scientific tools provide valuable information about the growth, quality, and quantity of vegetation in a specific area.
Thanks to satellite imagery like that used in OdinS, it’s possible to calculate the amount of light reflected by vegetation. This allows us to determine key parameters such as chlorophyll content, humidity, water stress, and other fundamental indicators for assessing plant health, which are represented through various vegetation indices.
Main vegetation indices
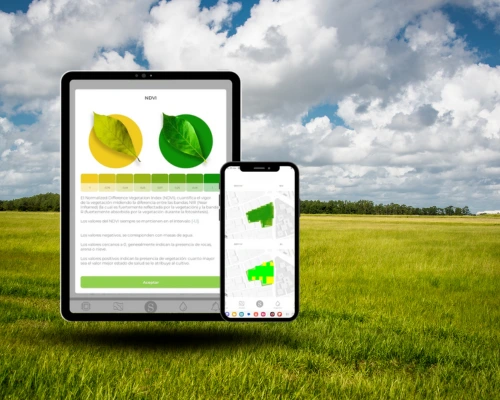
In this quick guide to vegetation indices, using images from our platform, we explain the main indices used in agriculture, what each one measures and what it is used for, with the aim of helping you correctly interpret satellite images and make better agronomic decisions.
NDVI: Normalized Difference Vegetation Index
The NDVI (Normalized Difference Vegetation Index) is the most well-known and widely used vegetation index in agricultural satellite imagery.
This index measures photosynthetically active biomass, that is, the greenness, density and overall condition of the vegetation.
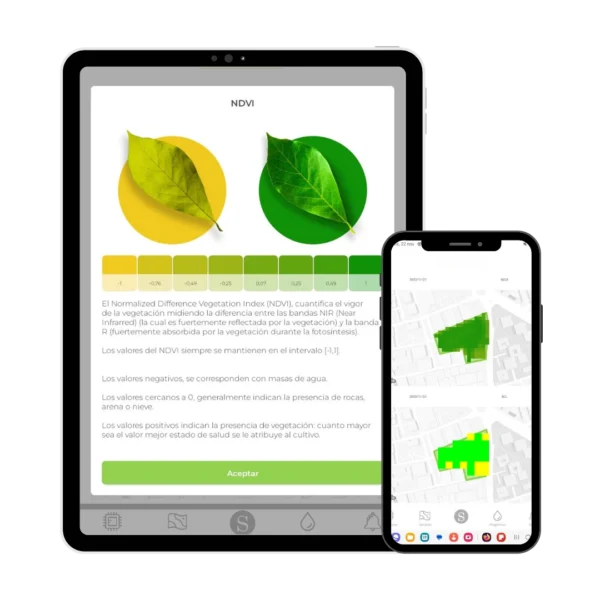
NDVI value range
- Values between -1 and +1
- High and positive values → healthy and dense vegetation
- Low or negative values → bare soil, water, or degraded vegetation
Main uses of NDVI
- Evaluate the overall condition of the crop
- Compare plots or agricultural campaigns
- Detect areas with low vigor
- Monitoring crop growth
It is ideal as a first overall analysis of the crop’s condition.
EVI: Enhanced Vegetation Index
The EVI (Enhanced Vegetation Index) is an improvement of the NDVI designed to correct its limitations in areas with high vegetation density.
It includes atmospheric corrections and reduces the influence of the ground, allowing for more accurate analysis when the NDVI is saturated.
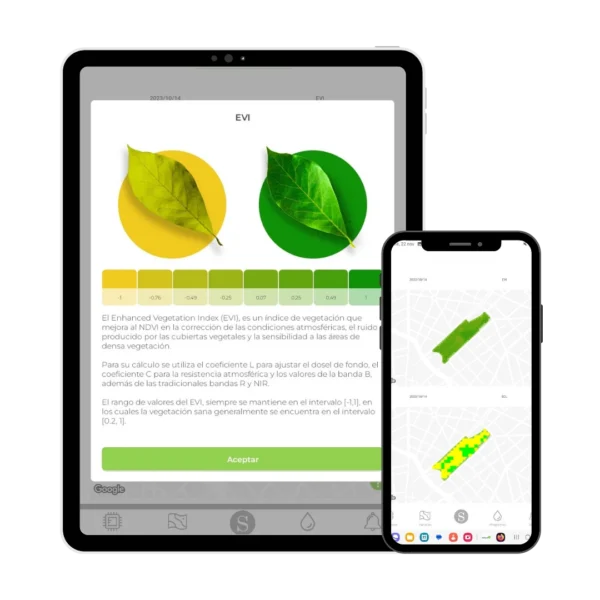
Range of values
- Between -1 and +1
- Optimal values between 0.2 and 1
When should the EVI be used?
- Highly developed crops
- Areas with high biomass
- Advanced analysis of plant vigor
NDWI: Normalized Difference Water Index
The NDWI is an index similar to the NDVI, but focused on detecting and analyzing water content in vegetation. It is especially useful for identifying drought conditions, as it responds more quickly to water stress.
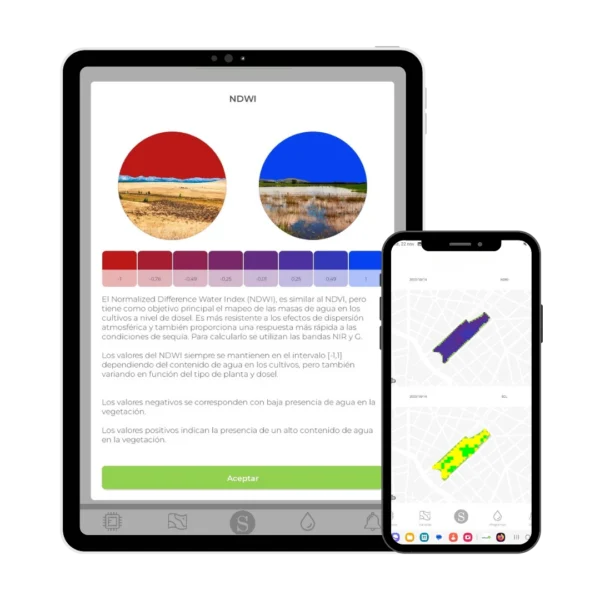
Range of values
- Between -1 and +1
- Negative values → low water content
- Positive values → well-hydrated vegetation
Applications of the NDWI
- Early detection of water stress
- Irrigation optimization
- Drought assessment
- Monitoring crop response to irrigation
It is one of the key indicators in efficient water management.
MSI: Moisture Stress Index or Water Stress Index
The MSI directly measures the level of water stress in the leaves. Unlike other indices, higher values indicate greater stress.
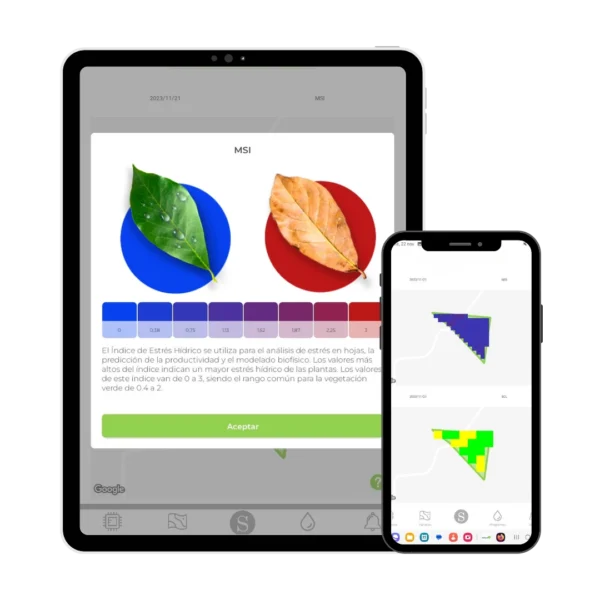
Typical range
- Increasing values → greater water stress
- Values between 0 and +3
- Common range for green vegetation: approximately between +0.4 and +2
Uses of MSI
- Anticipate irrigation problems
- Prioritize critical areas of the plot
- Making quick decisions in water scarcity situations
TCARI and OSAVI
The TCARI/OSAVI relates chlorophyll uptake (CARI) and transformation (TCARI), and combines it with the soil-adjusted optimized vegetation index (OSAVI). Thus, they are useful for quantifying chlorophyll in plants and adjusting reflectance in areas with bare soil.
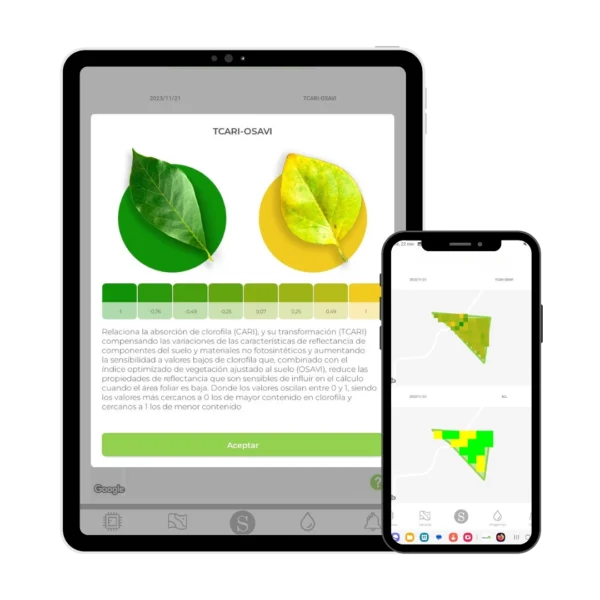
Range of values
- Between 0 and +1
- Values close to 0 → high chlorophyll content
- Values close to 1 → lower content
SAVI: Soil Adjusted Vegetation Index
SAVI is a variant of NDVI designed to reduce the influence of soil brightness, especially when vegetation cover is low.
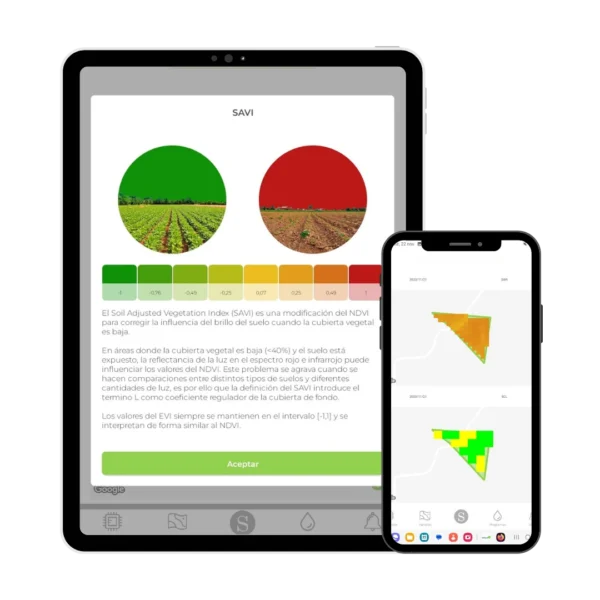
Range of values
- Between -1 and +1
- Negative values usually indicate healthier and denser vegetation.
When to use SAVI
- Initial stages of cultivation
- Plots with bare soil
- Semi-arid zones
How to use vegetation indices in precision agriculture
As you have seen, vegetation indices are key tools for accurately and objectively understanding, analyzing, and monitoring vegetation status. They allow us to move from visual observation to data-driven agricultural management. Each index provides different information about the crop, and their combined use improves decision-making.
We hope this content has helped you better understand their differences and applications. Want to learn more?
Don’t forget to follow us on our social media channels to stay up to date on everything!